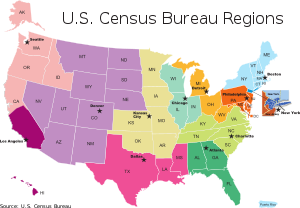
| English: U.S. Census Bureau Regions, Partnership and Data Services Program. A map of the US Census Bureau Regions. (Photo credit: Wikipedia) |
In a recent post we noted that about a third of adults receiving government assistance had disabilities of some type. This caused us to question whether transition in specific and special education in general were succeeding with respect to the goal of creating independent adults.
Well last week our friends at the U S Census Bureau provided more numbers to cause us to repeat these questions. They have released the Disability Employment Tabulation which has a wealth of statistical information about people with disabilities in the workforce. You can review the deep well of information on the Disability Employment Tabulation through this link.
Here is a small sample of the in formation available:
Between 2008 and 2010, individuals without disabilities were about three times more likely to be employed than individuals with disabilities. Overall, individuals with disabilities accounted for 9.4 million, or 6.0 percent, of the 155.9 million civilian labor force.
More than half of all workers with a disability were concentrated in four general occupation groups: service workers (except protective services) with 18.2 percent, followed by administrative support (15.1 percent), sales workers (10.4 percent) and management, business and finance (8.9 percent).
Among specific occupations, janitors and building cleaners had the highest number of employees with a disability at 315,000, or 11.8 percent of all workers in that field, followed by drivers/sales workers and truck drivers with 263,000 people, cashiers with 256,000 and retail salespeople with 223,000.
Among occupations with 100,000 or more people, dishwashers had the highest disability rate at 14.3 percent, followed by refuse and recyclable material collectors (12.7 percent), personal care aides (11.9 percent), and janitors and building cleaners (11.8 percent). The rates for refuse and recyclable material collectors, personal care aides, and janitors and building cleaners were not statistically different from one another.
More than half of workers with disabilities (52 percent) earned less than $25,000 in the previous year, compared with just 38 percent of workers with no disabilities. This translates into an earnings gap where individuals with disabilities earn about 75 percent of what workers without disabilities earn.
Overall, janitors and building cleaners were among the most common occupations for individuals with a disability for non-Hispanic whites (184,000 people), non-Hispanic blacks (60,000) and Hispanics (54,000).
Individuals with disabilities accounted for 6.3 percent of the male civilian labor force and 5.7 percent of the female civilian labor force.
The three most common occupations for men with disabilities were drivers/sales workers and truck drivers (246,000); janitors and building cleaners (217,000); and laborers and freight, stock, and material movers (171,000). For women, they were cashiers (195,000); secretaries and administrative assistants (189,000); and nursing, psychiatric and home health aides (172,000). The number of male laborers and freight, stock, and material movers was not significantly different from the number of female nursing, psychiatric and home health aides.
Any thoughts?


